MSGIS Portfolio
Yiwei Wang
Is cancer incidence related with age ?
Introduction: People always related cancer with death, incurable disease. In the medical profession, cancer is one of the hottest topic as well as the hardest, no doctor or medical organization could say that they can cure a caner patient for sure. Therefore, it is important to study cancer, and find out what elements influence cancer. In my project, I was focused on the relationship between people who get the cancer and their age. There are many kinds of different cancers, do they influenced by age? I did analysis for each of them by using R statistical software based on linear regression model, and quarry which are influenced by age, which are not influenced by age. My null hypothesis was age is not related with cancer incidence in Utah, and alternative hypothesis was age is related with cancer incidence in Utah.
Method and Result: The project was using R statistical software to analyze the relationship between age and cancer. Standard categories include many types of cancer,such as stomach and small intestine. The age range I chose were from 0 to 75, because the population of people who are older than 75 is minority, this small population will lead the result inaccurate. The data was all kinds of cancer and the related age group and the counts. The linear regression model was the main method to test each of these cancers. From my analysis of the result, I rejected null hypothesis. The fact was people who get cancer is influenced by people's age. Before age 74, the older the person is, the higher probability is he/she get cancer.
Geographical Data Analysis
Skills(Spatial Analysis, Spatial Data and Algorithms): The project design, implement, and report on the analysis of the relationship between age and cancer use related data. Null hypothesis was people who get this kind of cancer and people's age are independent, and alternative hypothesis is people who get this kind of cancer and people's age are related. Figure.1 shows the relationship between Oral Cavity and Pharynx cancer and age, it is one of the result in the project. However, the data I used in my project was not spatial data. I will show how to use spatial data to analyze below.
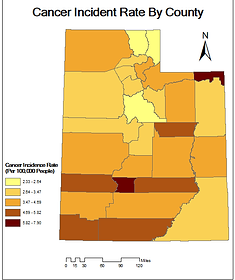
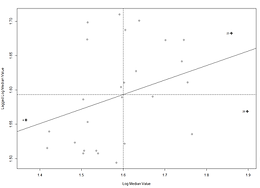
Spatial Data Analysis & Spatial Data and Algorithms: To get a better understanding of the influence of cancer to people, spatial autocorrelation is good to research. If the result was significant, after comparing significant areas with non-significant areas, it is easier to find out the elements that caused a higher cancer incident rate, such as air quality and industrial. The datasets I used were rate of cancer incidence in each county in Utah State downloaded from Utah Department of Health, and Utah state county boundary from AGRC. The cancer data could not be used directly for spatial analysis, it needed to evaluate cancer data with Utah State boundary data to see if they can match, then create, manipulate, edit, and convert the cancer data to another format in preparation for spatial analysis. I used interpolation to combine the data(cancer data and state boundary data). Figure.2 shows the cancer incident rate distribution in Utah. My null hypothesis was there was no significant spatial autocorrelation of cancer incidence at the county level, and alternative hypothesis was there is a significant spatial autocorrelation of cancer incidence at the county level. The first step was to create neighborhood structures for counties, which I selected boundary methods. The second step was to calculate spatial weights. And finally used Moran's I to analyze the spatial autocorrelation between cancer incidence and counties. Figure.3 is the relationship between cancer incident rate and the spatially lagged values of cancer incident rate. Because of a very high z-score in the result of Moran's I, so I rejected null hypothesis that there was no significant spatial autocorrelation between cancer incidence and counties. And the value of Moran's I is positive, it means the distribution of the rate of cancer incidence was clustered.

View the paper
Figure.1
Figure.2
Figure.3